Optimum Nitrogen Fertigation for Corn Using SDI
Freddie R. Lamm, Alan J. Schlegel, Gary. A. Clark 1
ABSTRACT
A four year study was conducted in western Kansas on a deep, well-drained, loessial Keith silt loam (Aridic Argiustoll; fine silty, mixed, mesic) to develop a Best Management Practice (BMP) for nitrogen fertigation for corn using subsurface drip irrigation (SDI). Residual ammonium- and nitrate-nitrogen levels in the soil profile, corn yields, apparent nitrogen uptake (ANU) and water use efficiency (WUE) were utilized as criteria for evaluating six different nitrogen fertigation rates, 0, 80, 120, 160, 200, and 240 lbs/acre. The BMP was a nitrogen fertigation level of 160 lbs/acre with the total applied nitrogen including other non-fertigation applications of approximately 190 lbs/acre. The BMP also states that irrigation is to be scheduled and limited to replace approximately 75% of ET.
Corn yield, ANU, and WUE all plateaued at the same level of total applied nitrogen which corresponded to the 160 lbs/acre nitrogen fertigation rate. Average yields for the 160 lbs/acre nitrogen fertigation rate was 213 bu/acre. Corn yield to ANU ratio for the 160 lbs/acre nitrogen fertigation rate was a high 53:1. The results emphasize that high-yielding corn production also can be efficient in nutrient and water use.
PROCEDURES
The project was conducted at the KSU Northwest Research-Extension Center at Colby, Kansas on a deep, well-drained, loessial Keith silt loam, a medium-textured soil, typical of many High Plains soils. The 8-ft profile will hold approximately 17.5 inches of plant available water at field capacity. The continental climate can be described as semi-arid with an average annual precipitation of 18.7 inches. The experimental treatments (fertigation levels) as described below were applied during the 1993 corn growing season to develop approximately equilibrium soil profile and crop residue nitrogen levels before the 1994 season. No further discussion of the 1993 season will be made.
A modified, ridge-till system was used in corn production with two corn rows, 30 inches apart, grown on a 5 ft wide bed. In November, a preseason application of ammoniated superphosphate was broadcast applied at the rate of 15 and 13 lbs/acre of nitrogen and 51 and 45 lbs/acre P2O5 for the respective years, 1994-95. No preplant fertilizer was applied during the fall of 1993. Corn (Pioneer 3162)2 was planted at approximately 32,900 seeds/acre April 25, 1994, May, 11, 1995 and April 22, 1996. Ammoniated superphosphate (10-34-0), at the rate of 5 lbs/acre of nitrogen and 17 lbs/acre P2O5 was applied at planting in 1994. In 1995 and 1996, a mixture of UAN (32-0-0) and ammoniated superphosphate (10-34-0) was applied at planting at the rate of 16 lbs/acre of nitrogen and 27 lbs/acre P2O5 Nitrogen in the starter fertilizer, and the residual and mineralized nitrogen in the soil were the only sources available to the crop until the first irrigation was applied on June 14, 1994, June 20, 1995 and June 26, 1996.
The study utilized a SDI system (Lamm et al., 1990) constructed with dual-chamber drip tape (12-in emitter spacing) installed at a depth of 16-18 inches with a 5-ft spacing between dripline laterals. Irrigation was scheduled using a climatic-based water budget using data from a NOAA weather station located at the Center. The specifics of the calculations of reference evapotranspiration (ETr) and actual evapotranspiration (AET) are more fully described in Lamm et al. (1997). The water budget estimated the root zone depletion with precipitation and irrigation water amounts as deposits and calculated daily corn water use (AET) as a withdrawal. A previous study of subsurface drip-irrigated corn (Lamm et al., 1995) had indicated an irrigation level reflecting a 25% reduction in calculated AET from the fully irrigated condition will not significantly reduce corn yields. Modification of the irrigation schedule to reflect the 75% replacement was accomplished by multiplying the calculated AET value by 0.75. If the root-zone depletion became negative, it was reset to zero. The study plots were irrigated to replace 100% of the calculated root-zone depletion, when the depletion was within the range of 0.4 to 1.6 inches. Soil water amounts were monitored weekly during the growing season for each plot in 1 ft increments to a depth of 8 ft. Water use was calculated as the sum of seasonal changes in soil water between the first and last sampling dates, irrigation and rainfall. Runoff was restricted to the plot areas by the modified ridge tillage system.
All nitrogen in the study was applied as an experimental variable except for the small amounts supplied by the spring starter fertilizer application, and the naturally occurring nitrate-N in the irrigation water. Six seasonal amounts of injected nitrogen total, 0, 80, 120, 160, 200, and 240 lbs/acre were evaluated. Each treatment was replicated three times in a completely randomized block design. The nitrogen source, urea-ammonium-nitrate (UAN, 32-0-0) was injected at a depth of 16-18 inches with the SDI system on an approximately weekly basis beginning about 30-40 days after emergence. Weekly fractional amounts to be applied were estimated from a nitrogen-use curve developed at Iowa State University (Ritchie, et al., 1989). Although more complex models could be used for determining the amount of nitrogen to be applied, this model was used for simplicity and applicability by irrigators. Injections were made weekly at the plot level with a commercial, industrial-grade, diaphragm-type injector as an approximately 0.25-0.5 hour part of a multi-hour irrigation event. The period of irrigation before and after the injection period was always greater than 2 hours. The irrigation system applies approximately 0.05 inches/hour.
Available soil nitrogen was determined each spring near planting and after each harvest for all three years. Samples were taken in the corn row (15 inches horizontal distance from the dripline) in 6-in increments in the top 2 ft and in 12-in increments between the 2 ft and 8 ft soil profile depth. Soil samples were analyzed at the KSU Soils Lab for ammonium- and nitrate-N determination. Whole plant (above-ground) samples were also taken at physiological maturity for plant tissue analysis and determination of field biomass. The apparent nitrogen uptake (ANU) was calculated from the field biomass levels and the whole-plant nitrogen content. A representative plant sample was hand harvested at physiological maturity for yield determination. Irrigation water samples were analyzed for the amount of nitrate nitrogen near the end of each pumping season to determine the contribution of the irrigation water to the nitrogen budget of each crop. An earlier study by Lamm and Manges (1991) found nitrate levels in the water were near typical background levels, averaging 3.37 ppm.
RESULTS AND DISCUSSION
Climatic Conditions
The 1994 crop year was extremely good, in spite of the dry July-August period, with plant growth and development 7-14 days ahead of schedule by the time the dry period began. In contrast, extremely cool climatic conditions in 1995 resulted in late planting and poor growth during the early vegetative period. An early frost resulted in a very short growing season and consequently low corn yields. Abundant rainfall, low AET, and an extremely long and mild grain filling period resulted in high yields in 1996. The net irrigation requirement for corn is 15.4 inches based on an 80% chance precipitation. Seasonal irrigation amounts of 10.9, 12.0, and 6.0 inches were required in 1994, 1995 and 1996, respectively. Since the irrigation level by design was limited to replace on 75% of AET, the years 1994 and 1995 were near normal, but 1996 was much below normal. Although the climatic conditions for the 3 years were varied they do represent a good range of conditions for the results.
Residual Nitrate-N in the Soil Profile
After four years of continuous application (1993-1996, with 1993 not included in analysis) of the fertigation treatments, nitrate-N levels in the soil were increasing and moving downward when the fertigation rate exceeded 160 lbs/acre (Figure 1). The preseason ammoniated superphosphate, starter fertilizer at planting and the irrigation water would supply a small amount of additional N. As a result the threshold 160 lbs/acre rate of injected nitrogen would have resulted in a total applied nitrogen of 173, 201, and 194 lbs/acre for 1994, 1995, and 1996, respectively. The higher fertigation levels of 200 and 240 lbs/acre resulted in nitrate concentrations for some depth increments exceeding the 10 ppm maximum contaminant level specified for drinking water. In contrast, the lower fertigation rates had lower than 5 ppm nitrate-N for all depths and lower than 3 ppm for all depths except the surface 6 inches. The preplant ammoniated superphosphate and the starter fertilizer are part of an overall production scheme to maintain proper levels of phosphorus in the soil and to encourage early plant development, so it makes good sense to continue these practices as needed. Schlegel et al., (1995, 1996) found application of phosphorus beneficial to nitrogen management both in terms of higher net returns and decreased environmental risks. In terms of in-season fertigation, examination of the nitrate-N levels in the soil profile would suggest a BMP of approximately 160 lbs/acre.
Total Ammonium- and Nitrate-N in the Soil Profile
Some producers might wish to apply extra nitrogen fertilizer with the idea that nitrogen transformations in the soil might build higher long term fertility levels. Figure 2 shows the total ammonium- and nitrate-N levels for the 8 ft soil profile for the six sampling dates. Nitrogen levels in the soil profile were relatively stable at around 90 lbs/acre as long as the fertigation rate was at or below 160 lbs/acre with the exception of the high level measured for the 120 lbs/acre rate during the first spring. It is believed this point is an anomaly caused by the soil not yet being at equilibrium. The higher 200 and 240 lbs/acre rates were generally between two and three times higher in total profile ammonium- and nitrate-N. Their instability with time suggests that the 200 and 240 lbs/acre fertigation rates were not in equilibrium and that the instability was indicative of movement (leaching) or transformations. High nitrogen applications above a maintenance level required to maintain adequate soil fertility will not establish a higher equilibrium. There was a trend towards higher residual levels of nitrogen in the soil profile during the after-harvest period in all three years for the 200 and 240 lbs/acre fertigation rate but it was only statistically significant (P=0.05) in 1995 (data not shown). These data suggest a BMP of approximately 160 lbs/acre of in-season nitrogen fertigation would avoid a large buildup of nitrogen in the soil profile.
Corn Yields
Corn yields were significantly (P=0.05 significance level) different among fertigation levels in all 3 years. There were no statistically significant differences in yields above the 160 lbs/acre nitrogen rate. In 1995 and 1996, there were no significant differences above the 120 lbs/acre nitrogen rate. Maximum yields in 1995 were approximately 80 bu/acre lower than in the other two years due to a short growing season and poor growing conditions. The presence in the study area of Gibberella corn ear rot lowered 1996 yields approximately 30 bu/acre as compared to unaffected areas nearby. The presence of ear rot is not related to the study. It is related to climatic conditions and previous crop history. Mean corn yields (1994-96) were not significantly different down through the 120 lbs/acre nitrogen fertigation rate (Table 1). However, there was a more uniform plateauing of yields at the 160 lbs/acre nitrogen fertigation rate (Figure 3) and economics suggest the added nitrogen would be justified. Corn yields would continue to support a BMP of 160 lbs/acre of in-season fertigation.
Apparent Nitrogen Uptake
The amount of nitrogen in the above-ground biomass (ANU) was significantly different (P=0.05) among fertigation levels in all three years with a tendency for ANU to plateau at the 160 lbs/acre nitrogen fertigation rate (Table 1 and Figure 3). In 1995 and 1996, the lower 120 lbs/acre nitrogen fertigation rate was not significantly different from the 160 lbs/acre rate, but there was much higher ANU for the 160 lbs/acre rate in 1994. The three year average ANU exceeded the total amount of applied nitrogen for all nitrogen fertigation rates up to 200 lbs/acre indicating good use of the applied nitrogen (Figure 3). Averaged over 1994-96, the data would continue to suggest a BMP of 160 lbs/acre of in-season nitrogen fertigation. The 160 lbs/acre nitrogen fertigation rate resulted in a nitrogen use efficiency of 1.04 lbs N uptake for each bushel of corn which is considerably higher than the old rule-of-thumb ratio of approximately 1.25 lbs N uptake for each bushel of corn.
Table 1. Summary of corn yield, nutrient uptake, and water use efficiency data from a SDI
nitrogen fertigation study, KSU Northwest Research-Extension Center from 1994-96.
FertigationN rate | Total Applied N | Yield | Apparent Nitrogen Uptake | Water Use Efficiency1 | ||||||||||||
| lbs/acre | lbs/acre | bu/acre | lbs/acre | lbs/acre-inch | ||||||||||||
| 1994 | 1995 | 1996 | Mean | 1994 | 1995 | 1996 | Mean | 1994 | 1995 | 1996 | Mean | 1994 | 1995 | 1996 | Mean | |
| 0 | 13 | 41 | 34 | 29 | 73 | 69 | 62 | 68 | 54 | 47 | 59 | 53 | 191 | 151 | 136 | 159 |
| 80 | 93 | 121 | 114 | 109 | 179 | 137 | 157 | 158 | 123 | 87 | 126 | 112 | 400 | 276 | 344 | 340 |
| 120 | 133 | 161 | 154 | 149 | 217 | 150 | 211 | 192 | 182 | 155 | 209 | 182 | 493 | 287 | 453 | 411 |
| 160 | 173 | 201 | 194 | 189 | 254 | 163 | 223 | 213 | 275 | 167 | 225 | 222 | 532 | 323 | 487 | 447 |
| 200 | 213 | 241 | 234 | 229 | 252 | 166 | 212 | 210 | 262 | 212 | 236 | 237 | 524 | 324 | 452 | 433 |
| 240 | 253 | 281 | 274 | 269 | 257 | 165 | 237 | 220 | 249 | 181 | 206 | 212 | 523 | 302 | 512 | 446 |
| Mean | 205 | 142 | 184 | 177 | 191 | 141 | 177 | 170 | 444 | 277 | 397 | 373 | ||||
Least significant difference 0.05 | 22 | 20 | 42 | 21 | 43 | 36 | 62 | 30 | 60 | 52 | 86 | 44 | ||||
1Water use efficiency is defined as yield in lbs/acre divided by water use in inches.
Water Use and Water Use Efficiency
Water use efficiency (WUE) in all three years was significantly different (P=0.05) among treatments (Table 1) with a trend toward maximization of WUE at a nitrogen fertigation rate of 160 lbs/acre (Figure 3). The plateauing of water use efficiency (Figure 3) coincided with plateauing of corn yield and ANU at approximately 160 lbs/acre of in-season nitrogen fertigation (approximately 190 lbs/acre of total applied nitrogen). This emphasizes that high-yielding corn production also can be efficient in nutrient and water use.
Discussion of the BMP
The purpose of a Best Management Practice (BMP) is to protect water quality while still providing producers a way to remain economically viable. Some of the evidence presented in the previous sections indicated from a statistical standpoint that the 120 lbs/acre nitrogen fertigation rate was not significantly different (P=0.05). However, nothing in statistics requires producers to accept a 95% certainty level before they adopt a new practice. Indeed, they must also weigh the consequences of their adoption of the practice. If the probability and magnitude of the economic benefits (crop yields) exceed the costs of the practice (higher nitrogen costs and also environmental risks) then the producer will likely adopt the practice. Nitrogen fertilizer solution in the form of UAN (32-0-0) costs approximately US$0.139/lb, so increasing the nitrogen fertigation rate from 120 to 160 lbs/acre increased costs about US$5.55/acre. As shown in earlier sections, the 160 lbs/acre nitrogen fertigation rate does not appreciably affect the environmental risks. The 3-year mean corn yield was increased from 192.5 to 213.1 bu/acre by increasing the nitrogen fertigation rate from 120 to 160 lbs/acre. At a corn price of US$2.50/bu, the yield increase translates to a US$51.50/acre increase in gross revenues, which is over 9 times the cost of the additional fertilizer. As a result this is a good economically viable BMP with minimal environmental risk.
Formalized Statement of the BMP
A properly stated BMP will not only list the practice that is to be promoted, but also the assumptions and/or constraints under which it is to be used. While the establishment of BMPs is a function of regulatory agencies, the authors will suggest the essential elements and supporting data for a BMP for fertigation of corn using SDI. The BMP is:
Weekly injections (or more frequently) of nitrogen fertilizer solutions can be applied by SDI systems for well-managed irrigated corn production on deep silt loam soils. Irrigation shall be scheduled to replace approximately 75% of the calculated irrigation deficit attributable to evapotranspiration. The fertilizer injections should begin not sooner than 20 days after crop emergence or later than 30 days after crop emergence and should end not later than 30 days prior to physiological maturity. It is recommended that the cumulative in-season nitrogen fertigation amount should not exceed 160 lbs/acre and the total applied nitrogen (fertigation, preseason applications, starter fertilizer, and naturally-occurring amounts in the irrigation water) should not exceed 190 lbs/acre. An adequate overall nutrient management program including applications of Phosphorus should also be utilized to help ensure that the nitrogen amounts are utilized within the corn production systems. Annual or bi-annual soil testing is recommended to a depth of 5 ft to quantify residual soil nutrient levels. Large increases in soil nitrate-N levels over time indicate reductions in fertilization may be warranted. State-approved backflow prevention devices and proper chemigation procedures shall be used at all times. When applicable by state law, a certified chemigation operator shall monitor and control the fertigation applications.
Key assumptions and constraints were utilized in development of the BMP. Therefore the applicability and success of the BMP may be affected by variations from the following list of constraints:
Deep well drained silt loam soils.
Semi-arid climate with summer precipitation pattern.
Nitrogen solution in the form of urea-ammonium-nitrate (UAN)
High yielding corn production with mean yields above 200 bu/acre
5 ft dripline spacing between two 30-inch spaced corn rows
Fall disk-bedding tillage management to enhance residue recycling
Uniform and accurate chemigation equipment
Proper design, maintenance and operation of the SDI system.
CONCLUSIONS
In-season nitrogen fertigation for corn using SDI is a highly efficient production practice. The optimum in-season nitrogen fertigation level was 160 lbs/acre. This level resulted in average corn yields of 213 bu/acre and did not significantly affect the levels of residual nitrogen in the soil. Using weekly injections of nitrogen fertigation for corn not to exceed a seasonal total of 160 lbs/acre is a BMP. The BMP of 160 lbs/acre was not only very sound from an environmental standpoint, but had a 9 to 1 net returns advantage over the next lowest fertigation level (120 lbs/acre).
REFERENCES
Lamm, F. R., H. L. Manges, D. H. Rogers, W. E. Spurgeon, and M. H. Farmer. 1990. Design and installation of a drip irrigation system for research purposes. Presented at the 1990 international winter meeting of the American Society of Agricultural Engineers, Chicago, Il., December 18-21, 1990. Paper No. 902530 from ASAE, St. Joseph MI. 21 pp.
Lamm, F. R., and H. L. Manges. 1991. Nitrogen fertilization for drip-irrigated corn in northwest Kansas. Presented at the 1991 international winter meeting of the American Society of Agricultural Engineers, Chicago, Illinois, December 17-20, 1991. Paper No. 912596 from ASAE, St. Joseph Michigan. 17 pp.
Lamm, F. R., H. L. Manges, L. R. Stone, A. H. Khan, and D. H. Rogers. 1995. Water requirement of subsurface drip-irrigated corn in northwest Kansas. Transactions of the ASAE, 38(2)441-448.
Lamm, F. R., A. J. Schlegel, and G. A. Clark. 1997. Nitrogen fertigation for corn using SDI: A BMP. Presented at the 1997 international annual meeting of the American Society of Agricultural Engineers, Minneapolis, MN, August 10-14, 1997. Paper No. 972174 from ASAE, St. Joseph Michigan. 17 pp.
Ritchie, S. W., J. J. Hanway, and G. O. Benson. 1989. How a corn plant develops? Iowa State University, Cooperative Extension Service, Ames, Iowa. Special Report No. 48. 21 pp.
Schlegel, A. J., and J. L. Havlin. 1995. Corn response to long-term nitrogen and phosphorus fertilization. J. Prod. Agric. 8:181-185.
Schlegel, A. J., K. C. Dhuyvetter, and J. L. Havlin. 1996. Economic and environmental impacts of long-term nitrogen and phosphorus fertilization. J. Prod. Agric. 9:114-118.
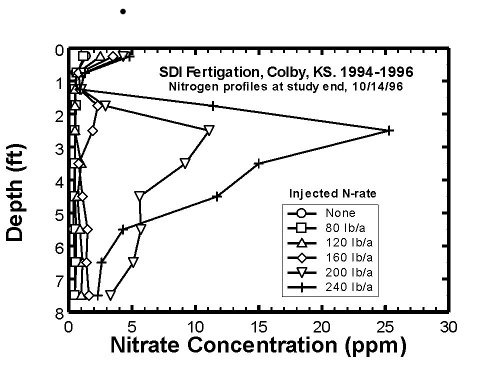
Figure 1. Nitrate-nitrogen concentrations in the soil profile for various nitrogen fertigation levels at the conclusion (10/14-96) of a SDI fertigation study in corn, KSU Northwest Research-Extension Center.
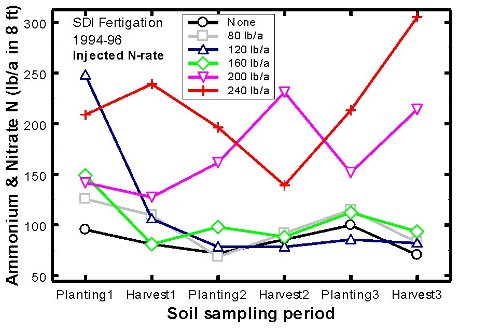
Figure 2. Total ammonium- and nitrate-nitrogen in the 8 ft soil profile for the six nitrogen fertigation levels for the six sampling dates in the study.
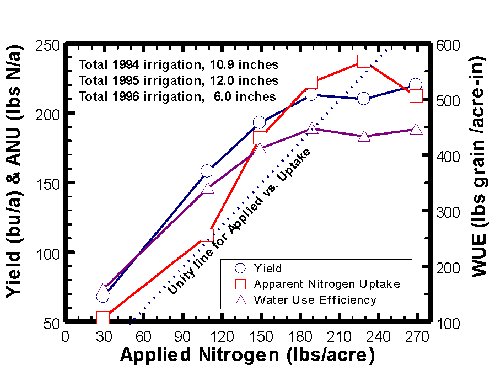
Figure 3. Average (1994-96) corn yield, apparent nitrogen uptake in the above-ground biomass, and water use efficiency as related to the total applied nitrogen (preseason amount, starter fertilizer, fertigation, and the naturally occurring N in the irrigation water). Total applied nitrogen exceeded fertigation applied nitrogen by 30 lb/acre.
1 The authors are Freddie R. Lamm, Associate Professor, Northwest Research-Extension Center, Kansas State University, Colby, KS., Email: flamm@ksu.edu, Phone: 785-462-6281, Fax: 785-462-2315; Alan J. Schlegel, Associate Professor, Southwest Research-Extension Center, Kansas State University, Tribune, KS., and Gary A. Clark, Professor, Biological and Agricultural Engineering, Kansas State University, Manhattan, KS.
This is a condensation of ASAE Paper No. 972174, Nitrogen Fertigation for Corn Using SDI: A BMP, first presented at the ASAE International Meeting, August 10-14, 1997, Minneapolis, Minnesota. This paper is contribution no. 98-125-A from the Kansas Agricultural Experiment Station. Any opinions, findings, conclusions, or recommendations expressed in this paper are those of the authors and do not necessarily reflect the views of Kansas State University or the US Department of Agriculture. This research constitutes part of a plan of work for the USDA-CSREES Western Regional Research Project W-128 and was also partially funded by the Kansas Fertilizer Research Fund.
2 The mention of trade names or commercial products does not constitute their endorsement or recommendation by the authors, the Kansas Agricultural Experiment Station, or by the U.S. Department of Agriculture.
