Using Subsurface Drip Irrigation With Livestock Wastewater
Todd P. Trooien, Freddie R. Lamm, Loyd R. Stone, Mahbub Alam,
Danny H. Rogers, Gary A. Clark, and Alan J. Schlegel[1]
ABSTRACT
INTRODUCTION
Using subsurface drip irrigation (SDI) with water from animal waste lagoons (hereinafter called wastewater) has many potential advantages. These include, but are not limited to, reduced human contact with wastewater; no runoff of wastewater into surface waters; placement of phosphorus-rich water beneath the soil surface where runoff potential is reduced; greater uniformity of water application resulting in better control of the water, nutrients, and salts; reduced corrosion of irrigation systems; reduced application constraint by weather (especially high winds and low temperatures); and increased flexibility in matching field and irrigation system sizes. Research has shown that soil acts as an additional treatment (or filter) for municipal wastewater applied through an SDI system.
Emitter clogging is a major problem associated with all microirrigation systems, including SDI (Nakayama and Bucks, 1986). The small emitters in SDI systems may be prone to clogging by the various constituents of the wastewater.
The design and management challenge of using SDI with wastewater is to prevent emitter clogging. Given that challenge, the objective of this project was to measure the performance of five different dripline types as affected by irrigation with filtered but untreated water from a beef feedlot runoff lagoon.
METHODS
This project was conducted at a beef cattle feedlot in Gray County, Kansas. The soil type is a Richfield silt loam. Water collected in the lagoon was runoff from pens containing beef cattle. Selected wastewater characteristics are shown in Table 1.
In April 1998, driplines were installed 0.43 m deep and on a lateral spacing of 1.5 m. Each plot was 6 m wide (4 driplines) and 137 m long. After completion and testing of the system, the lagoon wastewater was the only water applied with the SDI system; no clean water was used for irrigation, flushing, or dripline chemical treatment. Plots were arranged in a randomized complete block design with three replications. There was a border plot (using the 1.5 L/h/emitter laterals) at each of the north and south ends for a total of 17 plots.
Five drip irrigation lateral line (dripline) types, each with a different emitter flow rate (and thus different emitter size), were tested. The flow rates (obtained from the manufacturers) were 0.57, 0.91, 1.5, 2.3, and 3.5 L/h/emitter. The flow areas for those emitters were 0.43, 0.58, 0.81, and 1.7 mm2 for the four larger emitters. The emitter dimensions were not available for the 0.57 L/h emitters. The wide range of emitter flow rates (and sizes) was selected to determine the optimum emitter size that would be less prone to clogging when used with lagoon wastewater. Agricultural designs of SDI in the Great Plains with groundwater typically use lower flow rate emitters.
The wastewater was filtered with a plastic grooved-disk filter with flow capacity about 25% greater than the filter manufacturer's recommendations for wastewater (0.7535 m2 for our maximum flow rate of 454 L/min). The disks were selected to provide 200-mesh equivalent (openings of 55 µm) filtration even though the manufacturers' recommendations for all driplines were filtration of 140 mesh (openings of 104 µm) or finer. A controller was used to automatically backflush the filter after every hour of operation or when the differential pressure across the filter reached 48 kPa. To help keep bacteria and algae from growing and accumulating in the driplines and to clean lines of existing organic materials, acid and chlorine were injected simultaneously into the flow stream at injection points about 1 m apart every two to three weeks. Acid was added at a rate to reduce the pH to approximately 6.3. The acid used was N-pHuric 15/49, and the chlorine source was commercial chlorine bleach (2.5% Cl). Flushing (10 dripline volumes) took place using roughly the same schedule as acid and chlorine injection.
Table 1. Selected wastewater characteristics, Midwest Feeders, KS, 1998-1999.
| pH | EC | SAR | N | P | K | TDS | BOD | TSS | |
| (S/m) | (mg/l) | |||||||||
| Mar. 6, 1998 | 8.0 | 0.29 | 1.8 | 118 | 35 | 336 | 1875 | N/A | N/A | |
| Jun. 5, 1998 | 7.9 | 0.25 | 2.0 | 92 | 30 | 341 | 1613 | N/A | N/A | |
| Jul. 17, 1998 | 7.8 | 0.25 | 2.0 | 67 | 30 | 349 | 1625 | N/A | N/A | |
| Jul. 31, 1998 | 7.6 | 0.27 | 2.0 | 89 | 30 | 383 | 1728 | N/A | N/A | |
| Aug. 21, 1998 | 7.6 | 0.29 | 2.2 | 51 | 33 | 428 | 1856 | N/A | N/A | |
| Sep. 1, 1998 | 7.9 | 0.36 | 2.3 | 84 | 32 | 467 | 2304 | 96 | 190 | |
| May 12, 1999 | 8.2 | 0.53 | 8.7 | 260 | 39 | 724 | 3386 | 1033 | 580 | |
| Aug. 13, 1999 | 7.6 | 0.43 | 2.9 | 160 | 39 | 672 | 2739 | 405 | 1320 | |
| Sep. 10, 1999 | 8.0 | 0.53 | 2.8 | 140 | 31 | 724 | 3379 | 255 | 440 |
N/A: Not analyzed.
Abbreviations: EC: electrical conductivity, SAR: sodium adsorption ratio, N: total nitrogen, P: elemental phosphorus, K: elemental potassium, TDS: total dissolved solids, TSS: total suspended solids, BOD: biochemical oxygen demand.
To test the system, irrigations of 6 to 10 mm were applied daily from June through early September in 1998. During the growing season of 1999, occasional irrigations of 6 mm were applied in June and July and daily irrigations of 7 to 10 mm were applied from mid-July until early September. Each plot received the same application amount for a given day, so the run times for plots varied according to their emitter flow rates and emitter spacings. The average seasonal applications per plot were 530 mm (range: 524 to 531 mm) in 1998 and 390 mm (range: 388 to 395 mm) in 1999. The 1998 amount greatly exceeded the crop water requirements but allowed a more thorough test of the SDI system. Between the growing seasons, the system was used on October 6 and 7 and November 17, 1998 (DOY 279, 280, and 321) when the system flow rates were tested. In Kansas, few crops require irrigation during the winter months. Therefore, to reflect typical conditions, the system was allowed to remain idle from November 1998 to June 1999. This stagnation period might increase the potential for system degradation from clogging, but it represents practical operating conditions for our climate.
Emitter flow rates for entire plots were measured approximately weekly. Pressure gauges at the inlet end of the plots were used to measure the pressure at the dripline inlets. Totalizing flow meters measured the amount and rate of wastewater delivered to each plot. To test the flow rate of the driplines in an entire plot, the flow amount to each plot was measured and timed for approximately 30 minutes. Inlet pressures were recorded. To account for the variation due to minor fluctuations of pressures from test to test, the inlet pressure was normalized to the design pressure using the manufacturer's emitter exponent for that dripline type.
The recommended filtration for all of the emitters used in this study was 140 mesh. A 140-mesh disk filter was tested at 9 different lagoons- 5 beef feedlot lagoons and 4 swine lagoons- to measure the clogging of disk filters when used with wastewater. The tested filters had surface area of 0.0502 m2 and filtering volume of 5.92x10⁻⁴ m3. Wastewater was pumped through the filter at an initial rate of 80 L/s. The flow volume through the filter recorded with a data logger each 1,2, or 3 minutes, depending on the rate of clogging (higher frequency of logging when clogging was faster). The flow meter transmitted a pulse to the data logger after each 4 liters of flow. Inlet pressure and pressure downstream of the filter were measured independently with separate pressure transducers. The cumulative flow volume at pressure differential of 35 kPa (the pressure at which biological materials begin to extrude through a filter). The flow volumes are presented as volume divided by filter surface area to make the results applicable to other filter sizes. The test was replicated four times at each lagoon. The wastewater of each lagoon was sampled and the total suspended solids (TSS) and total dissolved solids (TDS) were measured.
RESULTS AND DISCUSSION
Of the five dripline types tested, the three higher-flow emitter sizes (1.5, 2.3, and 3.5 L/h/emitter) showed little sign of clogging (Fig. 1). Flow rates at the end of the test for those emitters were within 4% of the initial flow rates, indicating that very little clogging and resultant decrease of flow rate had occurred. The absence of clogging indicates that emitters of these sizes may be adequate for use with lagoon wastewater.
The two lower-flow emitter sizes (0.57 and 0.91 L/h/emitter) showed some signs of emitter clogging (Fig. 1) during the 1998 and 1999 growing seasons. Within 30 days of system completion in 1998, the flow rates in plots with both smaller emitter sizes began to decrease. The 0.57 L/h/emitter plots showed a gradual decrease of flow rate throughout the remainder of the test. By November 17, 1998 (DOY 321), the flow rate had decreased by 15% of the initial rate. The 0.91 L/h/emitter plots showed a decrease in flow rate of 11% of the initial rate by September 2, 1998 (DOY 245). Following harvest and the first (32-day) idle period, flow rates in the 0.91 L/h/emitter plots increased approximately 5% over the minimum measured rate. This increase indicates that some cleaning of the emitters had occurred in response to the flushing. The flow rate then stabilized for the rest of 1998 at about 9% less than the initial rate.
Following the winter idle period, all flow rates recovered to the initial flow rates (Fig. 1). Possible explanations for this include (a) the longer time that the acid and chlorine remained in the driplines allowed better control of biological clogging agents or (b) the cooler temperatures during the winter resulted in partial control of the biological clogging agents and the acid and chlorine were then more effective at cleaning up the remaining agents.
The smaller emitter sizes again showed decreasing flow rates during the 1999 growing season (Fig. 1). By the end of the growing season (September 10, 1999), flow rates had decreased by 22% in the 0.57 L/h/emitter plots and by 14% in the 0.91 L/h/emitter plots compared to the initial (maximum) flow rate. The decreases were constant throughout the growing season except for a 2-week period. The rate of decrease was less from August 10 to August 24, 1999. During the second week of that time period, no daily irrigations were applied.
The disk filter and automated backflush controller operated well in both years. Based on our observations, the hourly backflush frequency was adequate to prevent excessive accumulation of differential pressure and the set point of 48 kPa was never reached.
Clogging of the 140 mesh filter was highly correlated (Fig. 2) to the solids present in the lagoon, as represented by total suspended solids (TSS) plus total dissolved solids (TDS). The regression equation can be used for sizing a 140 mesh disk filter for use with wastewater. The TSS and TDS of the lagoon, flow rate of the pump, and desired time between backflushes must be known.
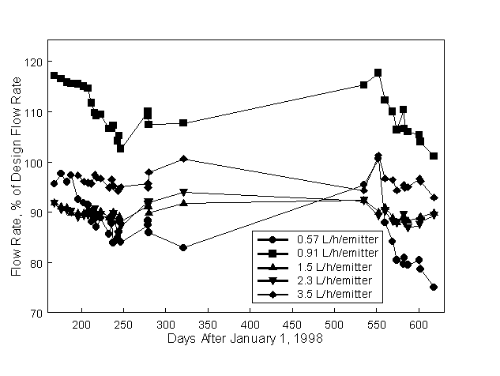
Figure 1. Measured flow rates for five dripline types with different emitter flow rates using lagoon wastewater, Midwest Feeders, KS, 1998-1999.
Excavation and visual inspection of dripline samples showed that flushing was effective in removing the accumulations of materials from the driplines. Prior to flushing, a slimy substance probably containing both silt and biological materials was present in the lines. After flushing, the driplines were clean.
Other management procedures might be employed to prevent performance degradation in the lower flow-rate emitters or remediate it after it occurs. Such procedures might include more frequent flushing, flushing with fresh water, and more frequent and concentrated chemical-injection treatments. However, the objective of this study was to compare the different driplines under difficult but identical conditions. Further studies are warranted to determine if the lower flow-rate driplines can be maintained at a higher performance level with more aggressive management.
The dripline performance was similar during two growing seasons, but questions still remain about the long-term, multiseason performance of SDI systems using livestock wastewater. These concerns are especially important in light of the decrease in flow rates of the two smallest emitters during both growing seasons. Long-term reliable performance probably will be necessary to justify the high investment costs of SDI systems.

Figure 2. Flow volume per unit filter area of 140 mesh filter at which the pressure gradient across the filter reached 35 kPa.
ACKNOWLEDGEMENTS
We thank Midwest Feeders for providing the site, wastewater, and assistance with the project. We also thank the numerous companies that donated irrigation products and services in support of this project. Technicians Rory Dumler, Mark Golemboski, Dennis Tomsicek, and John Wooden provided innumerable contributions to this study. Funding for the establishment of this project was recommended by the Governor's office, approved by the Kansas legislature in 1998, and administered through KCARE at Kansas State University. This material is based on work supported in part by the USDA Cooperative Research, Education, and Extension Service under Agreement No. 98-34296-6342. Any opinions, findings, conclusions, or recommendations expressed in this publication are those of the authors and do note necessarily reflect the views of the USDA.
REFERENCES
1. Nakayama, F. S. and D. A. Bucks. 1986. Trickle irrigation for crop production. Elsevier, Amsterdam.
Mention of product name is for information only and does not imply endorsement. Contribution number 00-474-A from the Kansas Agric. Exp. Stn., Manhattan, KS
[1] Authors are Todd P Trooien, Southwest Research-Extension Center, Garden City, KS; Freddie R Lamm, Northwest Research-Extension Center, Colby, KS; Loyd R Stone, Department of Agronomy, Manhattan, KS; Mahbub Alam, Southwest Area Extension Office, Garden City, KS; Danny H Rogers and Gary A Clark, Dept. of Biological and Agricultural Engineering, Manhattan, KS; and Alan J Schlegel, Southwest Research-Extension Center, Tribune, KS. Corresponding author: Todd P Trooien, Kansas State University SWREC, 4500 E Mary St, Garden City, KS 67846, voice: 316-276-8286, fax: 316-276-6028, email: ttrooien@ksu.edu.
